What Is a Synchronological Chart?
A synchronological chart sets the events of history side by side, so that what happened at the same time can be read together. Here is what the word means, and how Adams’ own Synchronological Chart does it.
In short: a synchronological chart arranges the events of history so that contemporary events can be read together. Wiktionary defines synchronism as “The tabular arrangement of contemporary events etc. in history.”
On this site you can explore one: Adams’ Synchronological Chart of Universal History, made by Sebastian C. Adams and entered for copyright in 1871.
What the word means
Two dictionary lines, from Wiktionary (consulted on November 18, 2026):
- synchronism: “The tabular arrangement of contemporary events etc. in history.”
- synchronology: “Contemporaneous chronology.”
Adams’ chart carries the word in its title
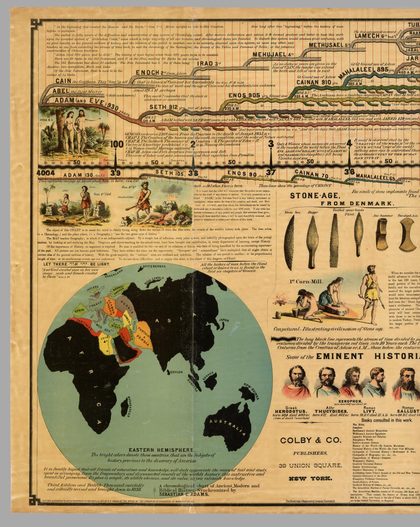
The title printed at the foot of Panel 1 reads “A chronological chart of Ancient, Modern and Biblical History, Synchronized by SEBASTIAN C. ADAMS.” The title page of the edition shown on this site reads “Adams’ Synchronological Chart of Universal History.”
The edition describes itself as the “Third Edition and Twelfth Thousand, carefully and critically revised and brought down to 1878,” and it includes additions from as late as 1881.
Why Adams made it, in his own words
“The object of this CHART is to assist the mind in clearly fixing, along down the stream of time, the time when the events of the world’s history took place.”
Sebastian C. Adams, Panel 1
Adams then lists what readers of history do not understand. One of the items is the subject of this page:
“… or its synchronous events, are not understood. To obviate these difficulties—and to supply this want, is the object of this diagram, or Chart.”
Sebastian C. Adams, Panel 1
How to read it
Time runs from left to right along a long black line that Adams calls the stream of time, divided into centuries by pillars and into decades by red lines. Each nation is a colored stream that begins when the nation first appears in history. As the Key puts it, events that happened at the same time are found by crossing the chart on a decade or century line, and lines that run together show a conquest.
Find dates along the Stream of Time, follow each nation as a colored stream, read a change of color as a new ruler, and cross the chart on a century or decade column to see everything that happened at the same time.
What happened at the same time: examples from the Key
The chart’s great strength is synchronology: by following one century or decade column across the whole chart, you see what was happening everywhere at once. The Key to the chart gives these examples:
- 22nd century BC: Noah, Shem and his descendants lived at the same time as Mizraim, founder of Egypt, Nimrod, founder of Babylon, and Asshur, who founded Assyria.
- 16th century BC: Troy and Athens were founded in the days of Moses and the bondage in Egypt.
- 10th century BC: Solomon was writing his Proverbs while Homer was writing the Iliad.
- 8th century BC: While Romulus ruled in Rome, Isaiah, Micah and Hosea were prophesying, and Sargon of Assyria carried the Ten Tribes of Israel into captivity.
- 6th century BC: Confucius taught in China, Solon gave Athens its laws and Pythagoras worked on mathematics, while Daniel saw his visions and Nebuchadnezzar built the walls of Babylon.
Our free guide, 10 Historical Synchronisms from Adams’ Chart, follows ten more of these crossings, step by step: get the free downloads.
One chart, several names
Adams Time Chart, Adams’ Map of History and Adams’ Synchronological Chart are names for the same work. Modern printed reprints are also sold under names such as “2.0” and “3.0”. Adams never numbered his chart 2.0 or 3.0; library catalogs describe his editions by number and year, a second edition brought down to 1876 and a third brought down to 1878. What is Adams’ Map of History? and Adams Time Chart 2.0 and 3.0 say more.
See it on the chart
-
 Free
Explore the whole chart
- Zoom into any century or decade column
- Search any name or date
- Nothing to download
-
 For adults and teachers
Read the chart panel by panel
- Every detail of Panel 1 explained
- Adams’ own words and the King James text
Panel 1 · $5 · all ten panels $39
See the book
Questions
What does synchronological mean?
Wiktionary defines synchronism as “The tabular arrangement of contemporary events etc. in history” and synchronology as “Contemporaneous chronology.” A synchronological chart is a chart built on that idea.
Is the Adams Time Chart a synchronological chart?
Yes. It is printed as “A chronological chart of Ancient, Modern and Biblical History, Synchronized by SEBASTIAN C. ADAMS,” and the title page of the edition shown on this site reads “Adams’ Synchronological Chart of Universal History.”
How do I read a synchronological chart like Adams’?
Time runs from left to right along a long black line that Adams calls the stream of time, divided into centuries by pillars and into decades by red lines. Each nation is a colored stream that begins when the nation first appears in history. As the Key puts it, events that happened at the same time are found by crossing the chart on a decade or century line, and lines that run together show a conquest.
Is Adams’ Synchronological Chart the same as the Adams Time Chart and the Map of History?
Adams Time Chart, Adams’ Map of History and Adams’ Synchronological Chart are names for the same work. Modern printed reprints are also sold under names such as “2.0” and “3.0”. Adams never numbered his chart 2.0 or 3.0; library catalogs describe his editions by number and year, a second edition brought down to 1876 and a third brought down to 1878.
Where can I see Adams’ Synchronological Chart online?
On adamschart.org, free: the whole Map of History, to zoom into, search and read.
Related
- Adams’ Map of History: What It Is and How to Read It
- The ten panels of the chart
- From Adam to Jesus: names, dates, about 4,000 years
- All Bible timeline topics
Text by Heritage Chronology Press. Adams’ words are quoted from the third edition of the chart, revised to 1878; dictionary lines from Wiktionary. Spotted an error? Tell us at [email protected].